
Every block has its own report. It tells you how often shoppers see and click the recommendations, which orders followed, and whether personalization is earning its keep.
Open a block and click Analyze at the top of the editor. The report covers the last 30 days; use the date picker at the top right to change the range.
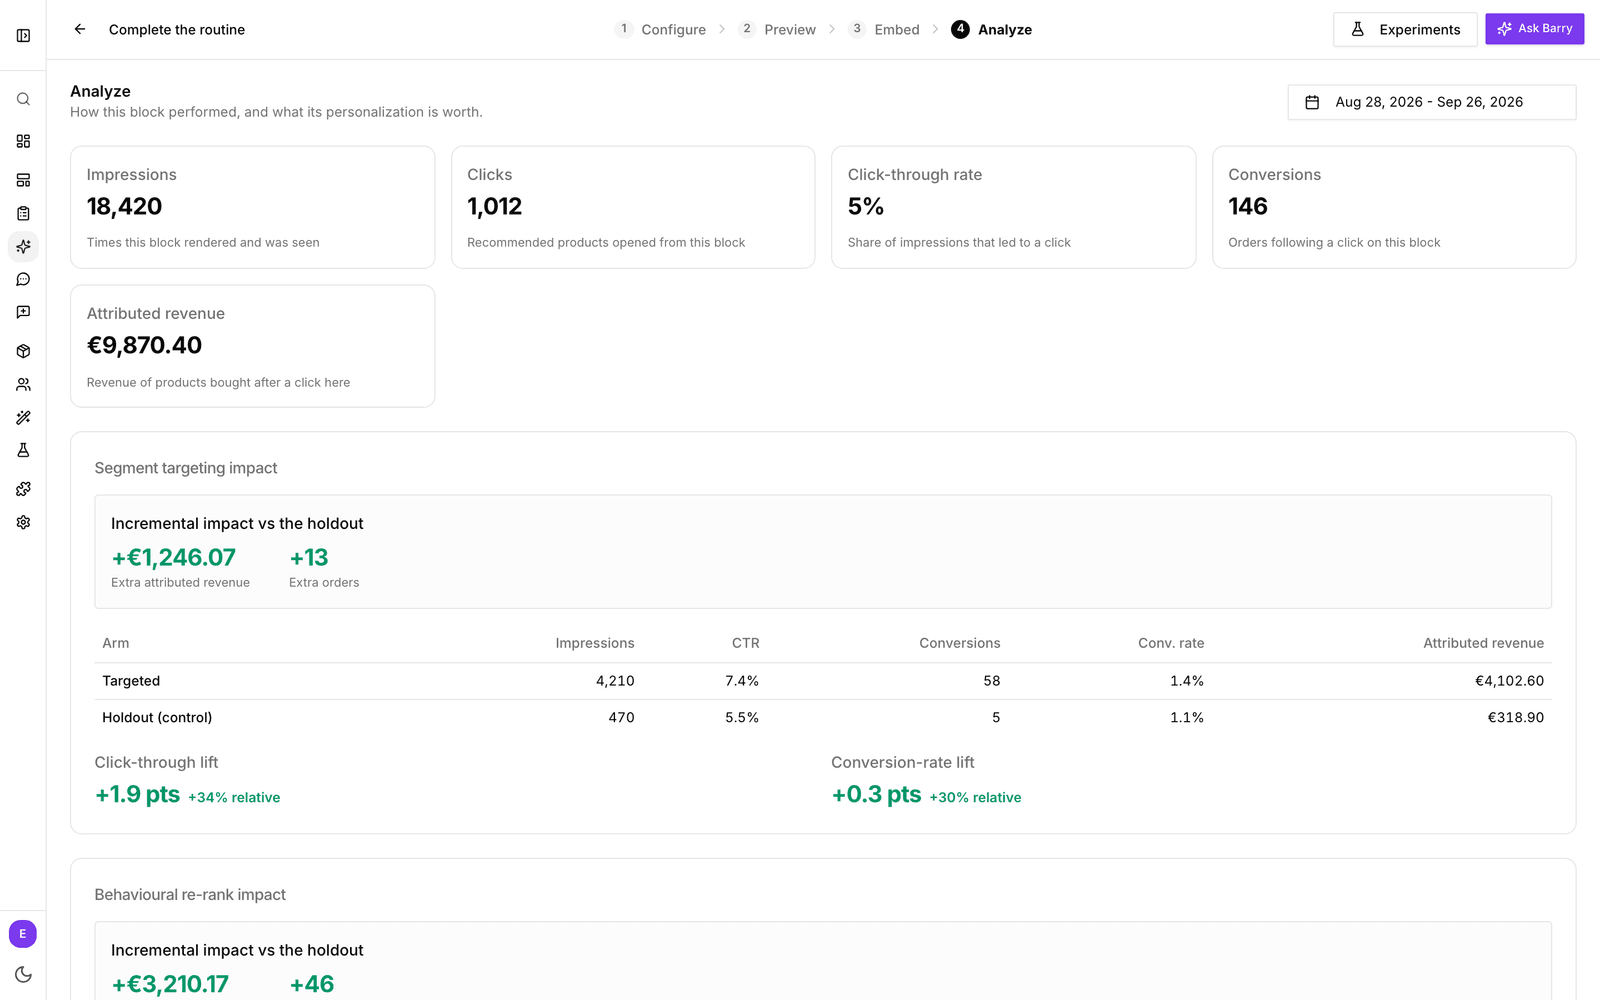
The headline numbers
| Metric | What it counts |
|---|---|
| Impressions | How often the block was actually seen. It counts once at least half of the first product card has been on screen for a second, or when a shopper clicks a product. |
| Clicks | Recommended products opened from this block. |
| Click-through rate | The share of impressions that led to a click. |
| Conversions | Orders placed within 7 days after the same shopper clicked a product in this block. |
| Attributed revenue | The value of those orders, in your store currency. |
Orders count through the checkout tracking that comes with the bluebarry Shopify app. See Track Shopify checkout conversions. The whole order counts, not only the recommended product, so read attributed revenue as "orders that followed a click" rather than extra sales. The impact cards below show what the block adds.
What personalization adds
Two cards compare shoppers who got a personalized block with a control group who did not. Each shows impressions, clicks, conversions, conversion rate and attributed revenue per group, plus the Click-through lift and Conversion-rate lift.
- Segment targeting impact: shoppers who got their segment's version (Targeted) against shoppers in the same segments who got the Everyone version instead (Holdout (control)).
- Behavioural re-rank impact: shoppers whose block was reordered by their own activity against shoppers with activity who kept the usual order.
Both tests run on the same traffic but answer different questions, so never add the two lifts together. "Too little traffic to trust yet" means one group is still too small: widen the date range or wait a little longer.
Performance by audience
The last table lists every version of the block: Everyone and each segment, with how many people are in it. Columns are Impressions, CTR, CTR lift, Conversions, Conv. lift and Revenue. Segments differ in who is in them, so repeat buyers will always click more than new visitors. Judge a segment version by its lift columns, which compare it with its own control group, not by its raw rates.
See every personalization in one place
Go to Analytics → Personalizations and set the surface filter to Recommendations. Every segment version appears as a row with its block name, and so does each block's Behavioural re-rank. Each row has a status such as Winning, Collecting or No effect, and clicking it opens the block. See Measure personalizations.
Barry and your weekly digest
Your weekly digest email gets a recommendations section with the week's numbers. Barry also looks for blocks that are seen but rarely clicked and products that fill a block without ever being clicked, and suggests a fix under For you on Home.
Tips for better numbers
- Give a new block one to two weeks before you judge it.
- A low click-through rate often means the block sits too far down the page, or shows too many products. Try fewer products or a spot closer to the add to cart button.
- Try a clearer title that says why these products are here, such as "Complete your routine".
- To compare two versions of a block fairly, use Experiments if you have them.