"Our quiz converts at 6%." Is that good? Without a reference point, every quiz metric is just a number. This report gives you the reference points: completion, conversion, revenue and list growth benchmarks from live product quizzes and finders running on bluebarry.
New to the format? Start with the complete guide to product recommendation quizzes and finders and come back here to judge your numbers.
Where these numbers come from
Everything below comes from two sources: our benchmark set of 130,000+ guided quiz and finder sessions across live bluebarry stores, and the published results of individual customers like Decathlon, Meroda, Powerstationshop and Ergo2Work. No survey data, no industry averages borrowed from someone else's PDF. Where a store is named, the figure is theirs; where a range is given, it spans the stores in the benchmark set. Catalogs, price points and traffic differ, so treat every number as a reference point, not a promise.
The benchmarks at a glance
| Metric | Benchmark | Top performers |
|---|---|---|
| Completion rate | 89% average; 80% is our internal bar | 94% median |
| Conversion of completed sessions | 4 to 29%, depending on placement and price point | 24% (Meroda, PDP mini-quiz) |
| Revenue per session | €11 median | Higher with bundles on the result page |
| Return on software cost | 26x to 373x attributed revenue | ~55x median |
| Email list growth | Store-dependent | 200% in three months (Powerstationshop) |
Completion rate: the health metric
Completion rate is the share of shoppers who start a quiz and reach the result page. It is the first number to check, because nothing else matters if shoppers bail halfway: no recommendation, no conversion, no data.
Across live finders the average completion rate is 89%, and the top performers reach a 94% median. Our internal bar is 80%: a finder below that gets fixed, not ignored. The usual culprits are too many questions, questions about the catalog instead of the shopper ("which wattage?" instead of "what do you want to power?"), and a mandatory email gate placed before any value is shown. The 90%+ completion group asks 5 to 8 questions about the shopper's situation, not the product's specs.
Conversion: what completed sessions are worth
Across the benchmark set, stores convert 4 to 29% of completed sessions into a purchase. That range is wide because placement and price point dominate: a €15 skincare product on a PDP mini-quiz converts very differently from a €2,000 e-bike finder, where the "win" is often a store visit or a configured quote.
Reference points from named stores: Meroda's PDP mini-quizzes convert 24% of completed sessions and lifted average order value 10%. Decathlon's 40 category finders convert at 10% across languages. Ergo2Work's quiz takers convert 126% better than regular visitors, and Powerstationshop saw a 124% conversion increase after replacing filter navigation with a finder. The pattern behind all four: quiz takers out-convert browsers, because a shopper who answered five questions has invested in the outcome and sees three fitting products instead of a wall.
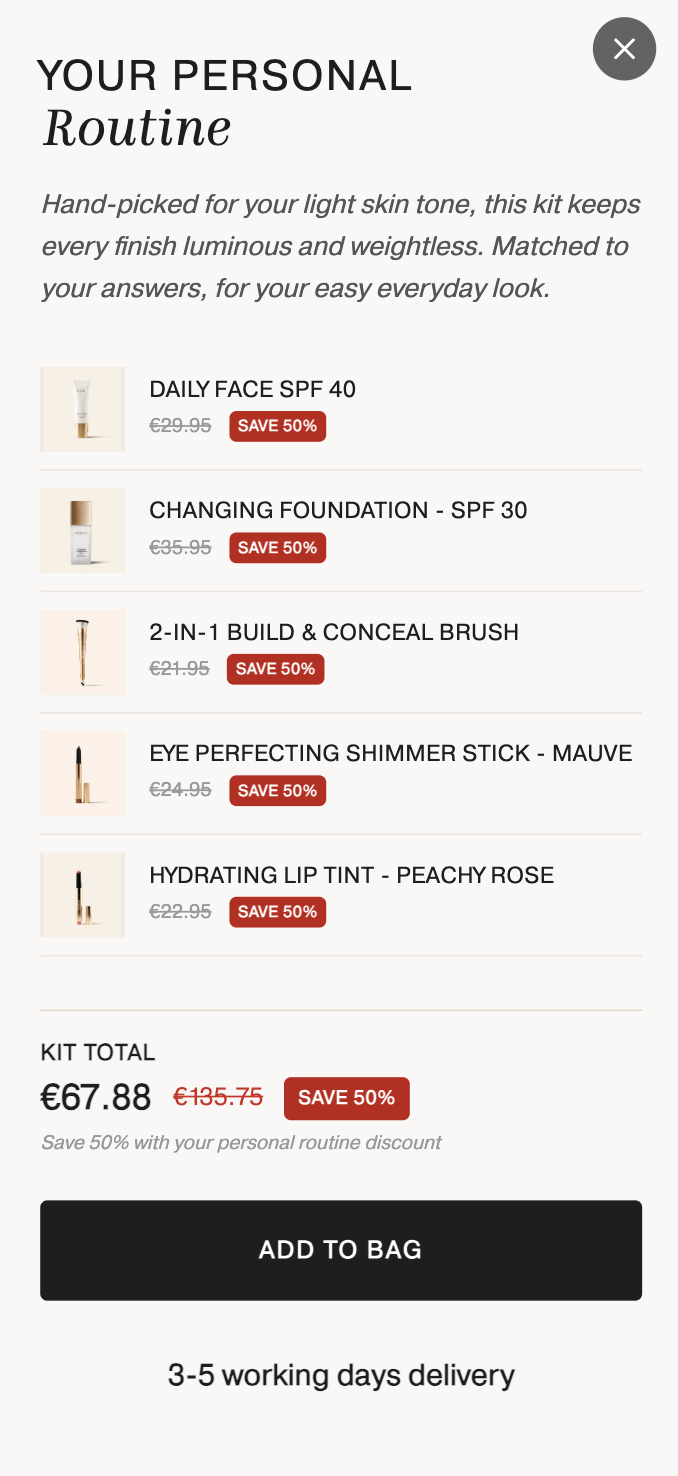
How these stores set their quizzes up, with screenshots: 5 product finder examples from real stores.
Revenue per session and return on cost
The number that settles budget discussions: across the benchmark set, stores earn a median of €11 in attributed revenue per completed quiz session. Multiply by your expected sessions and you have a business case that does not rely on soft metrics.
Measured against software cost, top-performing stores earn back 26x to 373x their subscription in attributed revenue, with the median around 55x. The spread is mostly traffic: the finder's cost is fixed while its output scales with every session, which is why the busiest placement on your store is the right first home for one.
Email list growth
A quiz with an email step grows your list with profiles that carry preferences, not just addresses. Powerstationshop grew their email list 200% in three months this way, and every signup arrived with quiz answers attached: what the shopper wants to power, for how long, at what budget. That is zero-party data your email flows can segment on from day one.
The benchmark to watch here is not the growth percentage, which depends on how small your list was, but the opt-in trade: shoppers leave an email when the result is worth keeping. Deliver the recommendations by email as a service, and the email step helps completion instead of hurting it.
See your own numbers instead
Describe your store and AI drafts a finder from your catalog. Free for 14 days, benchmarked against the numbers above.
How to use these benchmarks
Check your numbers in this order. First completion: below 80%, fix the questions before touching anything else. Then conversion of completed sessions against the 4 to 29% range, judged by your price point and placement. Then revenue per session against the €11 median. A finder that completes well but converts poorly usually has a result page problem: too many recommendations, no clear next step, or matches that miss. A finder that converts well but rarely gets started has a placement problem, so bring it to the shopper instead of hiding it in the menu.
Building your first one? The step-by-step version lives in how to build a product recommendation quiz, and the full picture of types, matching and placements in the complete guide.