The Dashboard gives you a quick view of quiz performance, funnel health, conversion trends, and question or answer behavior.
Review the Dashboard
- Go to Dashboard.
- Choose All quiz funnels or select a single quiz.
- Choose a date range such as Last 30 days.
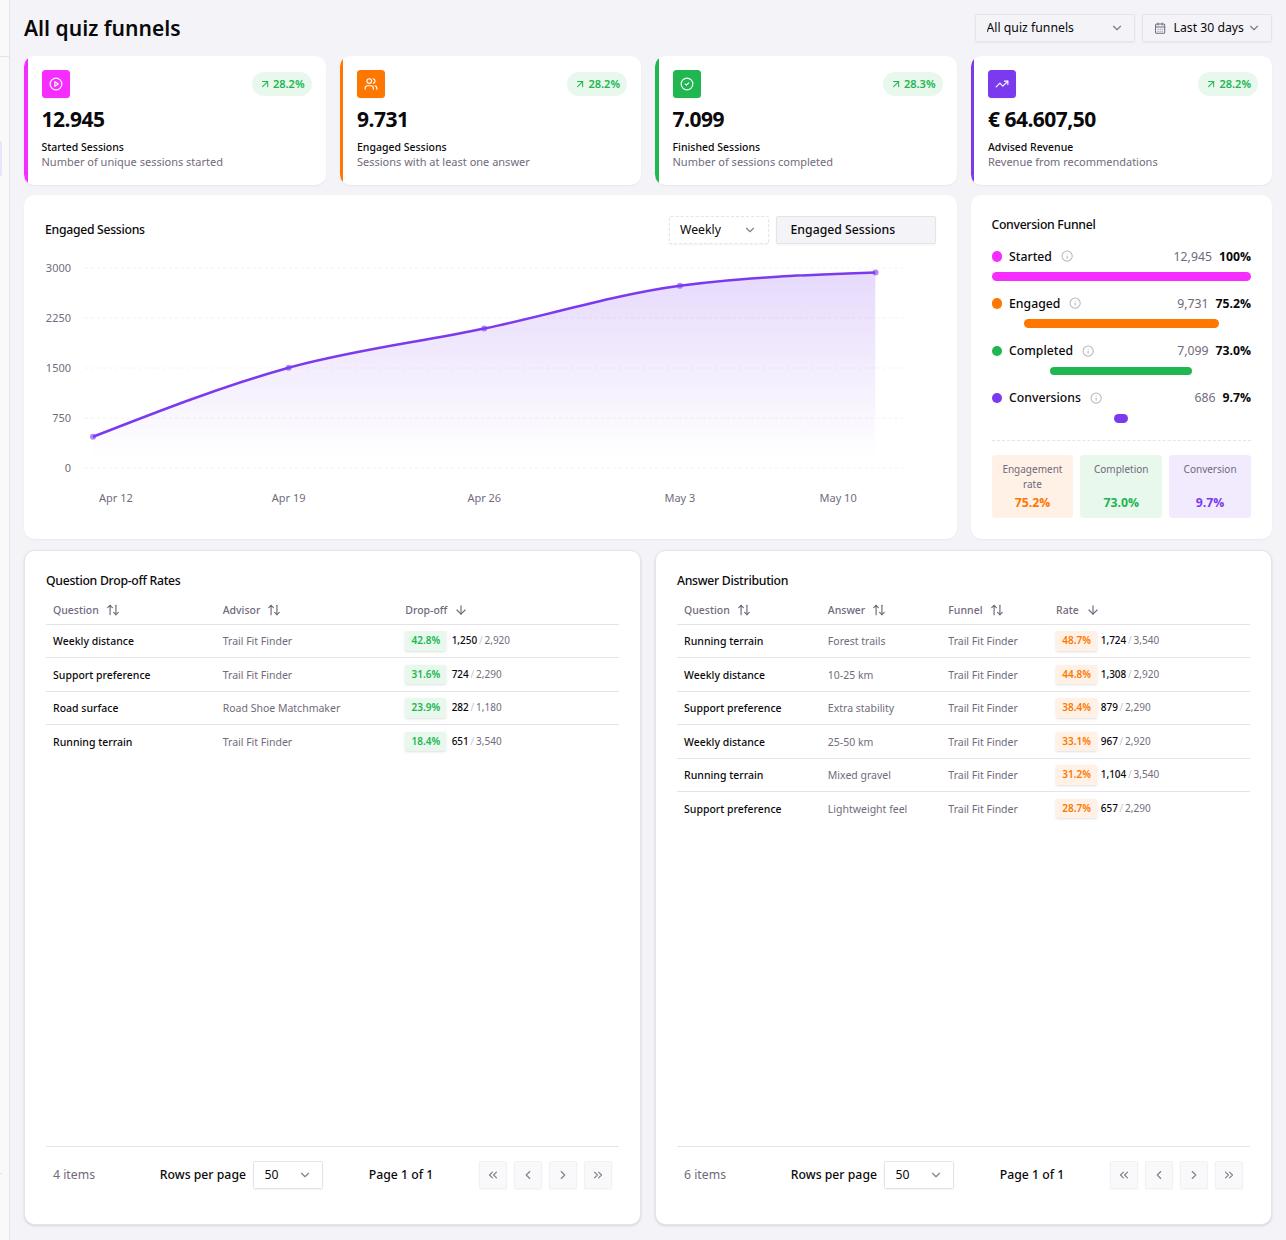
- Review Started Sessions, Engaged Sessions, Finished Sessions, and Advised Revenue.
- Use Conversion Funnel, Question Drop-off Rates, and Answer Distribution for deeper signals.
Key Areas
| Area | Use it for |
|---|---|
| KPI cards | Quick totals for Started Sessions, Engaged Sessions, Finished Sessions, and Advised Revenue. |
| Trend chart | Session, conversion, purchase, and revenue trends across the selected date range. |
| Conversion Funnel | Started, engaged, completed, and converted sessions. |
| Question Drop-off Rates | Questions where shoppers leave the quiz. |
| Answer Distribution | Answers shoppers select most often. |