Bluebarry
  • Pricing
  • Reviews
  • Resources
Sign inStart building
Help Center
Analytics and reporting
Analyze Question Performance

Analyze Question Performance

MD
Martijn Douma · Co-founder bluebarry
Last updated: May 15, 2026

Analyze question performance to find friction, drop-off, and questions that may need clearer wording.

Review Question Drop-off Rates

Question Drop-off Rates table in the BlueBarry Dashboard.
  1. Go to Dashboard.
  2. Select All quiz funnels or one quiz funnel.
  3. Choose the date range you want to analyze.
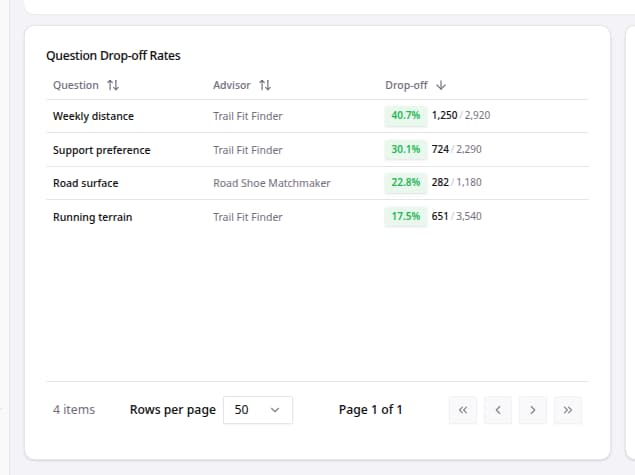
  4. Scroll to Question Drop-off Rates.
  5. Sort by Drop-off to review the highest-friction questions first.

Related articles

Dashboard Overview

The Dashboard gives you a quick view of quiz performance, funnel health, conversion trends, and question or answer behavior.

Filter Analytics by Date and Quiz

Filter analytics when you need to compare one quiz funnel, a specific date range, or the overall account performance.

Join the bluebarry community on Discord

Ask questions, share wins, and get support from the team and other e-com brands building with bluebarry.

Join Discord (free forever)

Need help?

If you can't figure it out, we probably can. Just give us a heads up in Discord or email ([email protected]).

Contact us

Platform

  • E-Com Funnels
  • Landing pages
  • Product Quiz
  • Recommendations
  • Integrations
  • Search
  • Pricing
  • Features
  • Reviews

Integrations

  • Shopify
  • Magento
  • WooCommerce
  • Klaviyo

Resources

  • Getting started
  • Resources
  • Help center
  • Shopify Quiz FAQ
  • Klaviyo Quiz FAQ

Contact

  • Partners & affiliate
  • Contact us
  • Request demo

[email protected]

+31 6 57 16 10 87

Hamburgerstraat 10, 9714 JB Groningen (The Netherlands)

LinkedInYouTube
Martijn Douma
Stan van Rooy
Anco Postma
Jelmer Reitsma

© 2026 Bluebarry AI. All rights reserved.

Privacy PolicyCookie PolicyTerms & Conditions