bluebarry.
ReviewsPricingResources
Sign inBook a 15 min demo
Help Center/Analytics and reporting/Analyze Answer Distribution

Analyze Answer Distribution

Martijn Douma
Martijn Douma · Co-founder bluebarry
Updated May 15, 2026

Analyze answer distribution to understand shopper preferences and demand patterns across quiz responses.

Review Answer Distribution
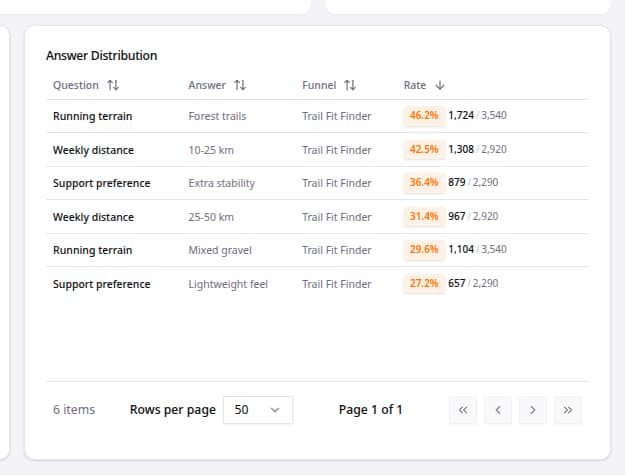
Answer Distribution table in the BlueBarry Dashboard.
  1. Go to Dashboard.
  2. Select All quiz funnels or one quiz funnel.
  3. Choose the date range you want to analyze.
  4. Scroll to Answer Distribution.
  5. Sort by Rate to see the most common answers first.

Related articles

Dashboard Overview

The Dashboard gives you a quick view of quiz performance, funnel health, conversion trends, and question or answer behavior.

Read article →

Filter Analytics by Date and Quiz

Filter analytics when you need to compare one quiz funnel, a specific date range, or the overall account performance.

Read article →

Can't figure it out? We probably can.

Every article here was written by the people who built the product. If one of them still leaves you stuck, tell us and we'll fix it.

Contact usJoin Discord, free forever
bluebarry.

Helping beauty, health and outdoor brands reach their dream AOV

[email protected]+31 6 57 16 10 87De Ried 10, 9285KK Buitenpost (The Netherlands)
Martijn DoumaStan van RooyAnco PostmaJelmer Reitsma

The guys that are increasing your AOV.

Platform
Quiz funnelsLanding pagesProduct QuizRecommendationsSearchIntegrationsPricing
Resources
CasesHelp centerFAQCompare
Company
Contact usPartners & affiliateReviewsRequest demo
Book a 15 min demo
© 2026 bluebarry. All rights reserved.
Privacy PolicyCookie PolicyTerms & Conditions
bluebarry